
What is an MTIE observation window?
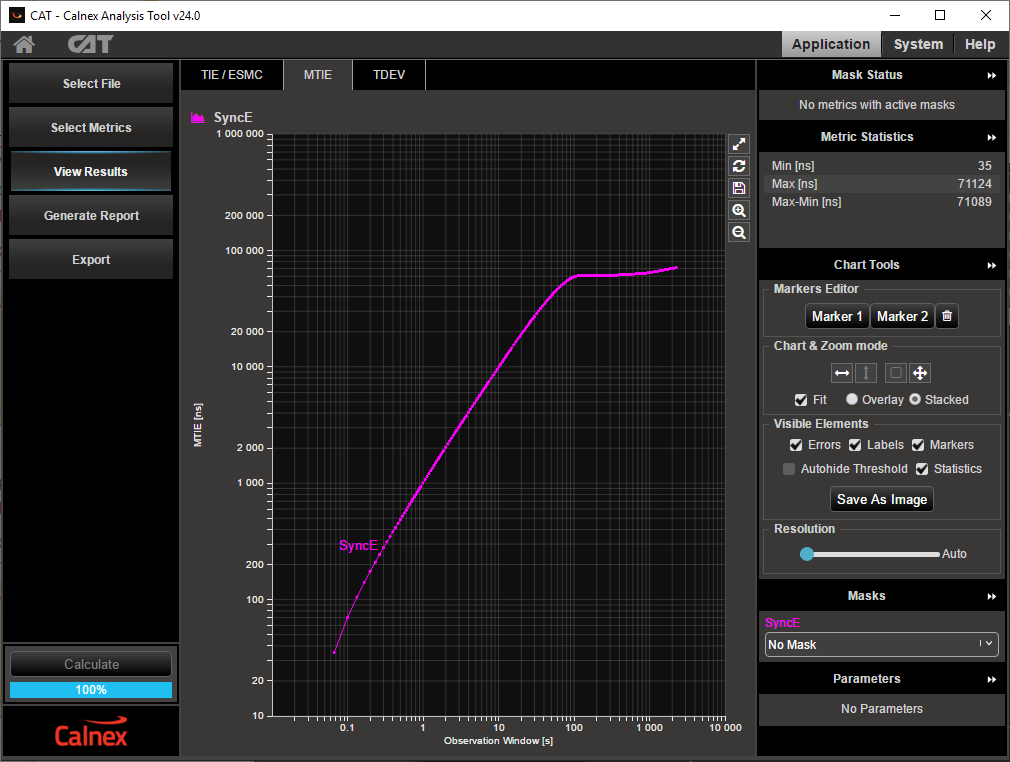
In CAT, I can see that the measurement result is plotted against an 'observation window (s)'. What is this, and how is it used?
Explanation:
The MTIE metric works by scanning a "window" across a sample set, and finding the largest variation in the Time Interval Error, TIE, within that window size across the entire capture. The window size is then increased, and the operation repeated. This loop is performed until the window size becomes equal to the capture duration.
To illustrate this, consider a window 'width' of x. We scan across the capture data to determine the maximum Time Interval Error, or MTIE, value for that window duration:
.PNG?version=1&modificationDate=1577954972680&cacheVersion=1&api=v2&width=480&height=270)
then repeat this for a window width of 2x:
.PNG?version=1&modificationDate=1577954971819&cacheVersion=1&api=v2&width=480&height=270)
We can see that the wider observation window contains a greater max-min TIE spread i.e. the MTIE for this observation window is larger. At least one instance of all larger window sizes will also contain this max-min spread, therefore an MTIE plot cannot show decreasing MTIE as the observation window size increases: MTIE can only be constant or increasing for increasing observation window sizes.
This scanning is performed from a minimum observation window size of 'twice the sample interval' up to the duration of the capture, and the results then plotted as MTIE (y-axis) against observation window size (x-axis). Typically both the x and y axes will be logarithmically scaled.
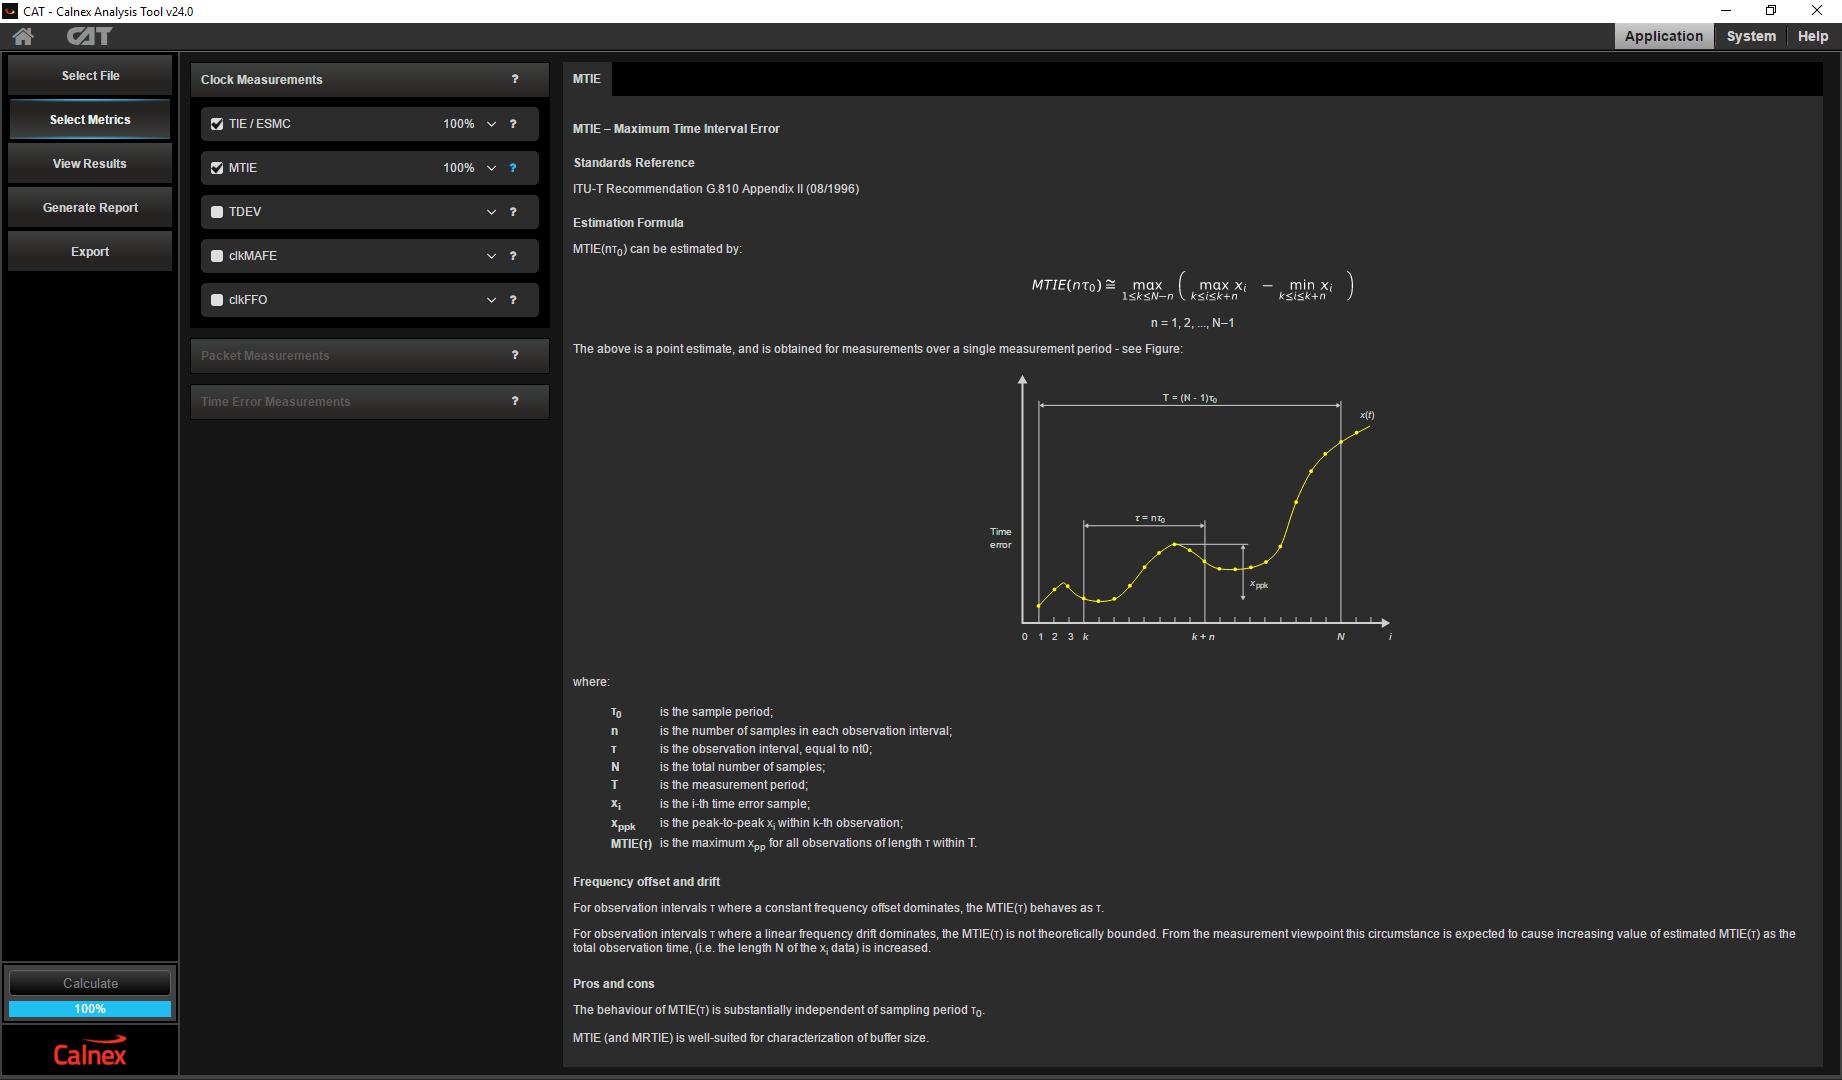
More information on the maths behind the MTIE metric is available in ITU-T Recommendation G.810 (08/1996), and by clicking the ? in the Select Metrics menu of CAT:
Related Articles