
Paragon-X: Can Paragon-X be used to measure Enhanced SyncE?
G.8262.1 has tighter specifications than G.8262. What does this mean for Paragon-X?
Summary
The ITU-T has just released Recommendation G.8262.1, the Enhanced Ethernet Equipment Clock (eEEC) specification. This is targeted at the synchronization requirements of “5G” cellular radio standards. The new specification is significantly tighter than the existing EEC specification defined in Recommendation G.8262.
Calnex's Paragon-Neo family is designed to measure the performance of enhanced clocks such as the eEEC.
This document describes the minimum requirements for a test instrument capable of verifying the performance of an Enhanced EEC device, and explains why it requires a Paragon-Neo over the Paragon-X test instrument.
Enhanced SyncE Wander Generation
The new enhanced SyncE clock specification G.8262.1 is about five times more stringent than the existing EEC specification (G.8262). This can be seen in the following chart, which shows the wander generation for the original EEC in orange, and the enhanced EEC in blue:
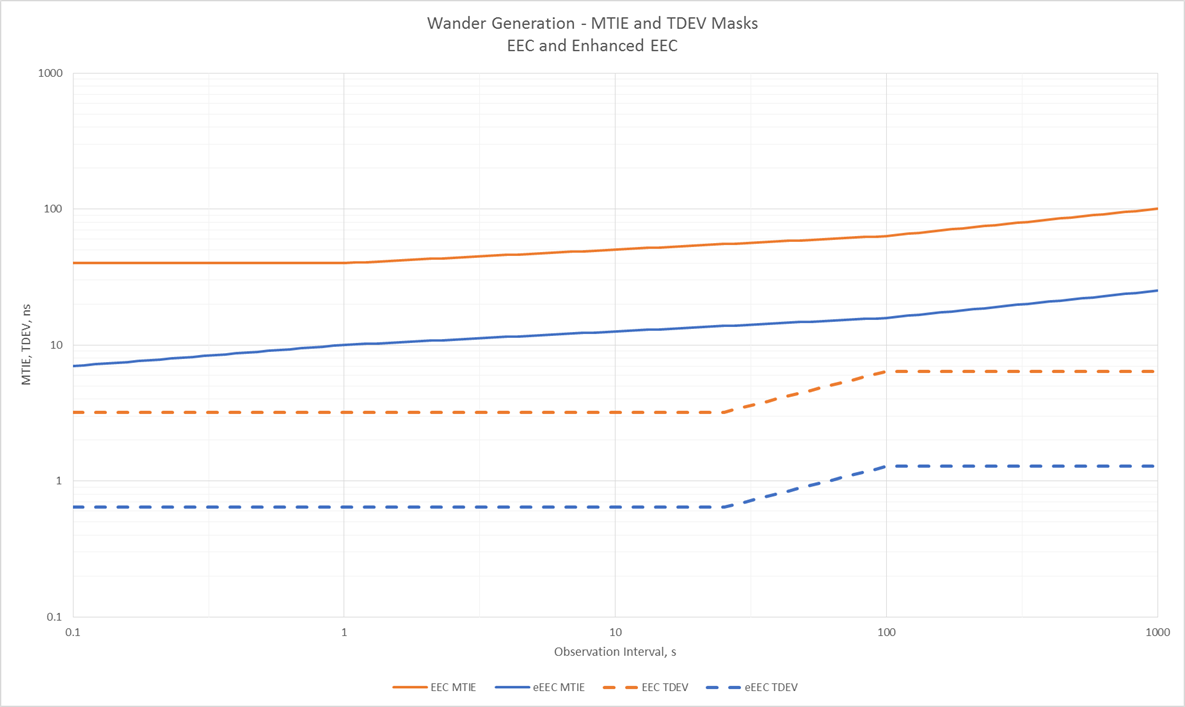
Therefore the test instrument required to measure enhanced SyncE needs to be significantly more sensitive than before.
A “rule of thumb” often applied to test instruments suggests that the test instrument needs to be about ten times more accurate than the quantity it is trying to measure.
MTIE Mask
When applying this to the MTIE mask, this is quite straightforward. An MTIE of 40ns (the existing G.8262 specification for observation intervals up to 1s) should require a test instrument with an accuracy of 4ns or better. For the enhanced EEC, with a minimum mask of 7ns, requires a test instrument with an accuracy of 0.7ns or better.
The test instrument accuracy is made of two parts: the resolution of the measurement, and also the stability of the internal reference clock. Where a stable external reference is used, the clock is likely much more stable than the resolution of the measurement, therefore the measurement resolution is the limiting factor.
TDEV Mask
For TDEV, the relationship is much more complex. It is not as straightforward as assuming that the measurement resolution is the same as the noise floor, because TDEV is based on a variance calculation using the root mean square of the measurement.
The TDEV formula is given below:
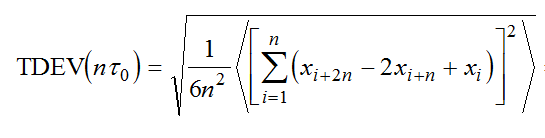
At the heart of TDEV is the second difference operation, (xi+2n – 2xi+n + xi). To calculate the noise floor of the measurement due to being at the limit of the resolution of the test instrument, we can assume that x can only take on the value 0 or 1.
In that case, there are 8 possible values for the second difference, as shown in the table below:
xi+2n | xi+n | xi | 2nd Difference xi+2n – 2xi+n + xi | 2nd Difference Squared (xi+2n – 2xi+n + xi)2 |
|---|---|---|---|---|
0 | 0 | 0 | 0 | 0 |
0 | 0 | 1 | 1 | 1 |
0 | 1 | 0 | -2 | 4 |
0 | 1 | 1 | -1 | 1 |
1 | 0 | 0 | 1 | 1 |
1 | 0 | 1 | 2 | 4 |
1 | 1 | 0 | -1 | 1 |
1 | 1 | 1 | 0 | 0 |
Sum of Squares | 12 | |||
Average | 1.5 | |||
TDEV | 0.5 | |||
This means that, if all eight possibilities are equally likely, the TDEV noise floor is 0.5 times the measurement resolution.
However, the occurrence of each of these possibilities is dependent on the noise type. For example, white noise (equal intensity at each frequency) exhibits a characteristic slope in TDEV of τ-0.5, in other words it slopes downwards to the right, starting from a value of 0.5. Therefore if the noise floor was entirely composed of white noise, it would quickly be averaged away at longer observation intervals.
Flicker noise (equal intensity in each decade of frequency) exhibits a characteristic flat slope on a TDEV plot, but at a level of approximately 0.25. This can never be averaged away with time.
It is not possible to state in advance what form the noise floor will take, since to some extent it is dependent on the input signal. For example, if the input signal is very slowly changing, the measurement resolution may cause slowly changing steps in the measurement. If the input signal changes fast, the measurement resolution may contain fast steps as the input signal passes the threshold for each
Therefore both white and flicker noise characteristics have to be considered. Noise types such as random walk (with its characteristic slope of τ+0.5) are not possible in a phase locked clock scenario, since they are not limited in phase excursion. The following chart shows the expected noise floor for both white and flicker noise types. The observation interval is in units of sampling period, while the vertical axis is in units of the measurement resolution.
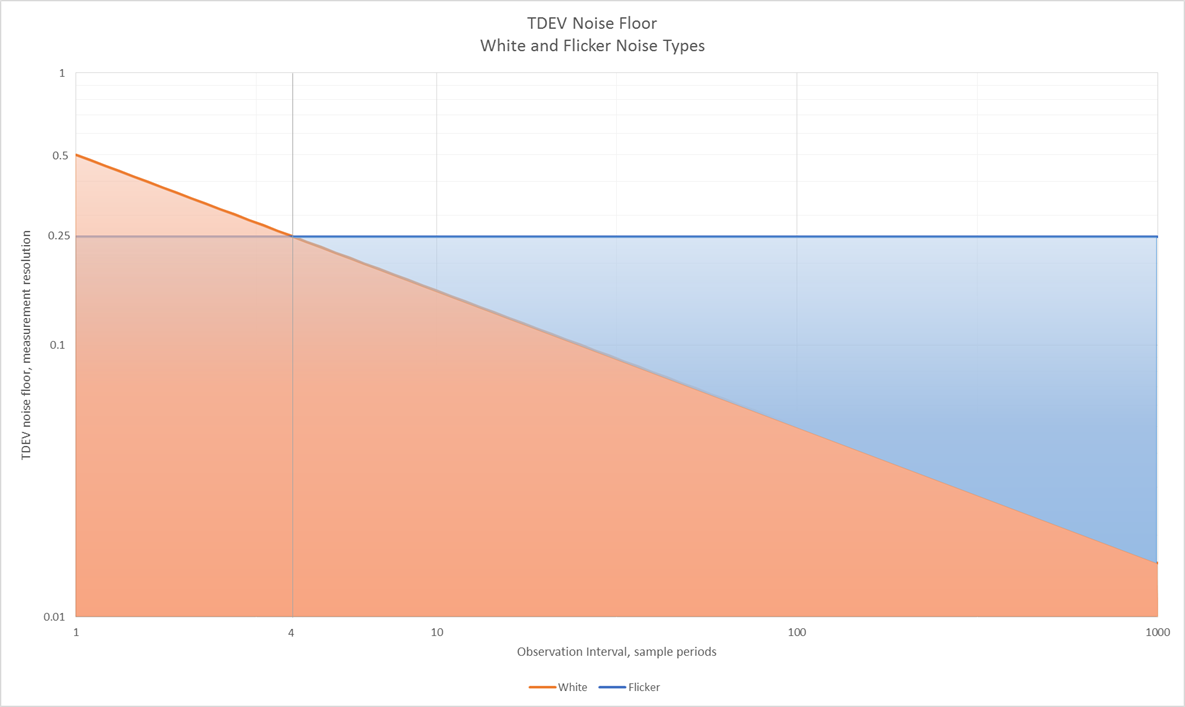
From the above graph, it can be seen that for observation intervals above four sampling periods, the noise floor is dominated by flicker noise. This is at approximately one quarter of the measurement resolution. Using the rule of thumb of noise floor being one tenth of the measurement size, the resolution must be smaller than four tenths of the lowest TDEV mask value.
Conclusion
For accurate measurement of clock wander generation, the test instrument measurement resolution should be lower than:
- One tenth of the lowest MTIE mask value
For an enhanced EEC, this is about 0.7ns (lowest MTIE is 7ns) - Four tenths of the lowest TDEV mask value
For an enhanced EEC this is about 0.25ns (lowest TDEV is 0.64ns)
Therefore for accurate measurement of enhanced SyncE clocks, the measurement resolution should be no larger than 0.25ns.
Since Paragon-X has a measurement resolution of 1ns, it is not sufficient for accurate measurement of enhanced SyncE clocks. Paragon-Neo has a measurement resolution of 0.25ns, and should be used instead.
Related articles