
The relationship between max|TE|, cTE and dTE is shown in various ways in different Calnex documents. How should I interpret these to understand what dTE actually means?
Answer
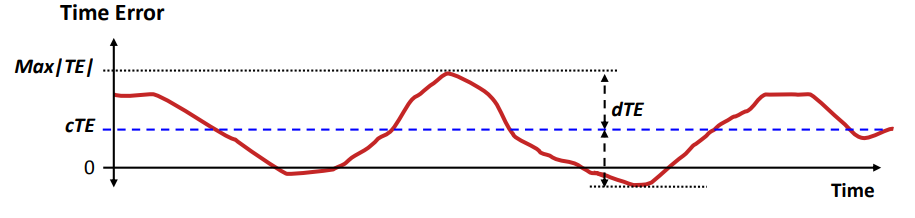
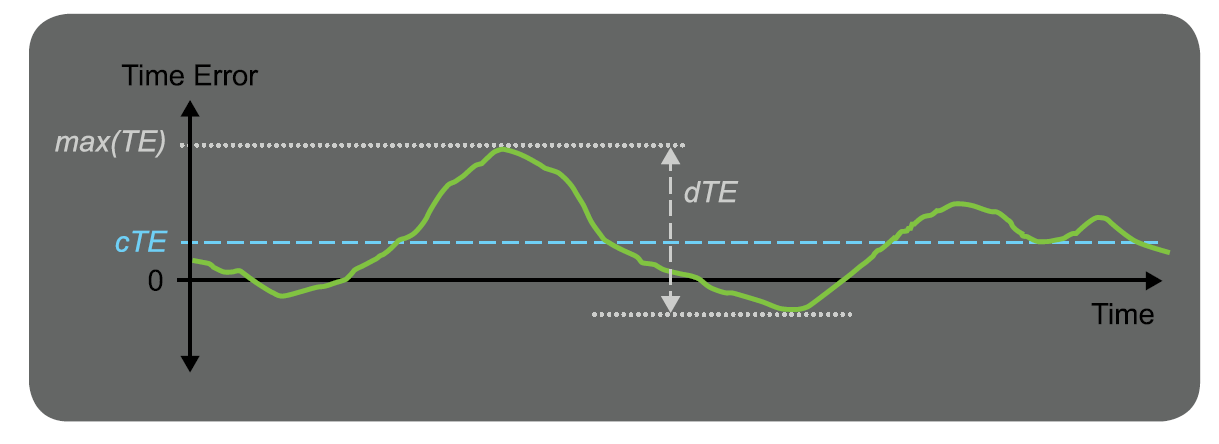
These images are attempts to illustrate the concept of dTE as the variation of time error rather than define it in mathematical terms.
There are several ways that this variation can be described:
- Peak-to-peak
- Plus or minus
- Something more complex like MTIE.
and so the graphs below illustrate different ways of doing so as they have been created at different times.
In CAT, a dTELF MTIE graph and a dTEHF peak-to-peak measurement are shown, which are two different ways of measuring dTE. As there is no single way to measure dTE, the method used can depend on what properties we’re interested in, and over what timeframe.
The equation x(t) = cTE + dTE (your 2nd equation) does apply if it uses the right measurements i.e. dTE needs to be a signed variation around the mean.
However, to calculate the dTE metrics in CAT we use a different method:
- normalise the data to the first point (like TIE)
- Filter it (high or low pass)
- Measure it as a peak-to-peak value or an MTIE
Processed in this way, the mathematical expression, x(t) = cTE + dTE does not apply, other than in the conceptual sense that time error is a variation (dTE) and an offset (cTE).
Related articles