
G.8271.2: pktSelected2WayTE Step Size
Introduction
G.8260 describes the pktSelected2WayTE metric for estimating the time error of a PTP packet stream that has been transmitted through a network exhibiting significant queuing delays (PDV, or packet delay variation). It selects a percentage of packets in a given window size, and averages them together to form a single value for that window.
G.8271.2 uses the metric to define the network limit in both APTS and PTS network configurations. It defines the window size as 200s, but doesn’t define a stepping size. For example, should the next window contain all new data, or should it partially overlap with the current window? This study presents eight example data sets, and analyses the difference made by using different stepping sizes. Of these data sets:
- Examples 1 and 2 were collected in a lab environment, using real switches and routers but at least part of the PDV was created by a packet impairment tool
- Examples 3, 4 and 5 were collected from a live operator network
- Examples 6, 7 and 8 were collected from a different operator’s live network
The Appendices present the raw data from the study for reference.
Effect of Step Size
The following chart (Figure 1) shows the variation of the peak-to-peak value of the pktSelected2WayTE function reported using different step sizes. The function is calculated according to G.8271.2 using a window size of 200s and a percentile of 0.25%. The vertical axis is the difference in the reported peak-to-peak value in nanoseconds, relative to the value for a 1s step size. Eight example data sets are shown, with the step sizes of 10s, 25s, 50s, 100s, and 200s.
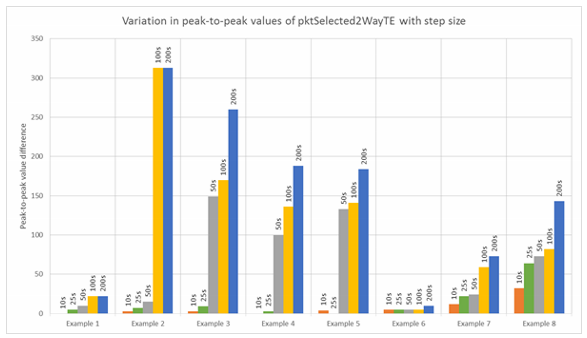
Figure 1: Variation in peak-to-peak values with step size
The second chart (Figure 2) shows the difference in the measurement of both the maximum and minimum peaks of the pktSelected2WayTE function:

Figure 2: Variation in max/min values with step size
Clearly, the step size has a big influence on the actual peak-to-peak value reported. Stepping the window rather than sliding it effectively sub-samples the pktSelected2WayTE function. The position of any peak in the function relative to the stepping point is critical, as shown in Figure 3 below.
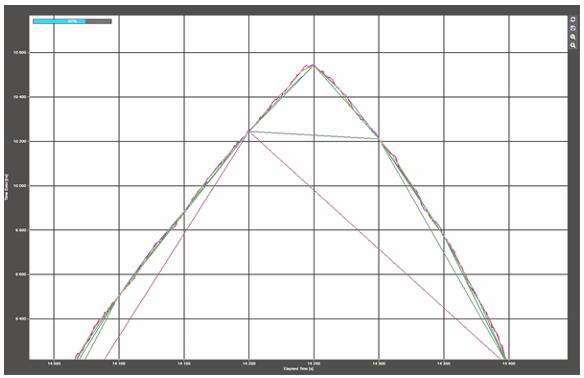
Figure 3: Position of step size with respect to peak value
In this example, the peak coincides with the 1s, 10s, 25s and 50s step increments. However, using 100s and 200s step sizes, the peak is missed, resulting in about a 300ns difference in reported value.
In some cases, changing the step size can change which peak in the data set is being reported. This is shown in the following example (Figure 4). The purple trace was obtained using a 1s step size, while the orange trace was obtained using 200s. It can be seen that the 200s step size identifies an entirely different peak in the data.
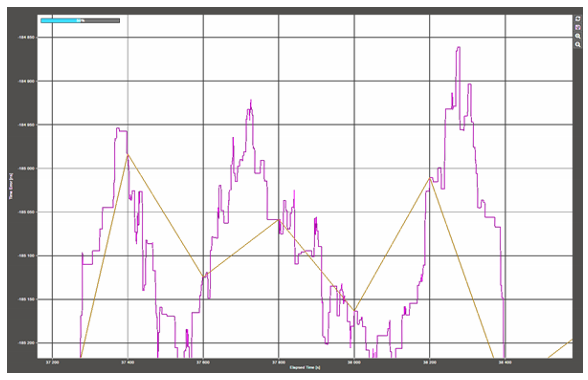
Figure 4: Change of reported peak with step size |
Which step size to use?
If step size has such a large effect on the outcome, why not use a sliding window (i.e. a step size of 1 sample)? There are several reasons not to use a very small step size:
- Smaller step sizes will increase the peak-to-peak measurement, making it harder to meet the network limits
- The end clock will have a low-pass filter that is likely to have a very low bandwidth, meaning that any peaks or troughs in the floor will tend to be smoothed. Therefore the peak-to-peak value obtained from a very small step size may not resemble the actual effect of floor variation on the clock output.
- The compute power needed is much higher for small step sizes. There is a 200-fold increase in compute power required for a step size of 1s compared to that of 200s. This should not be an issue for the clocks themselves because the pktSelected2WayTE metric is not a definition of the algorithm a clock must use, but it is an issue for the test equipment which may need to compute the metric in real time.
The chart below (Figure 5) shows both the mean error and the maximum error introduced by each step size, for both peaks and troughs. The grey and orange bars are the mean values across all examples for both peaks and troughs respectively. It can be seen that the mean value increases significantly from 25s to 50s.
The blue and yellow bars show the largest observed error in peaks and troughs respectively. Looking at the 25s step size, with the exception of one data set (example 8), the peak error is less than 5ns, while for troughs, the largest error is less than 18ns. Moving up to 50s step size, the peak error doubles to almost 100ns, while the error in the lowest trough triples to over 60ns.
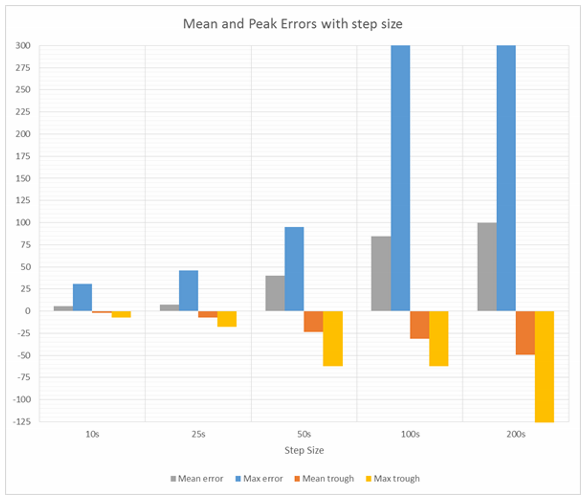
Figure 5: Mean and peak errors with respect to step size
Conclusions
Step sizes larger than 25s make a considerable difference in the maximum and minimum values of the pktSelected2WayTE function, and hence to the peak-to-peak value.
While G.8273.4 has not specified the clock bandwidth, it is commonly expected to be in the 1 to 5mHz range. A 5mHz clock has a time constant of about 32s. The stepping size of the metric should be smaller than the time constant of the clock, but not too much smaller otherwise the peak will be unrepresentative of the clock’s ability to handle floor variations.
Calnex therefore propose that a 25s step size is a good compromise between the required accuracy of the measurement, the compute power required to calculate the metric, and the actual effect on the end clock.
Appendix 1: Raw data sets
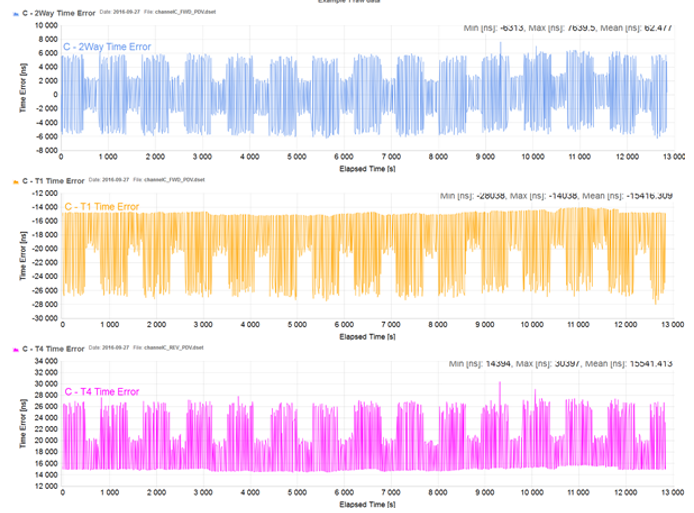
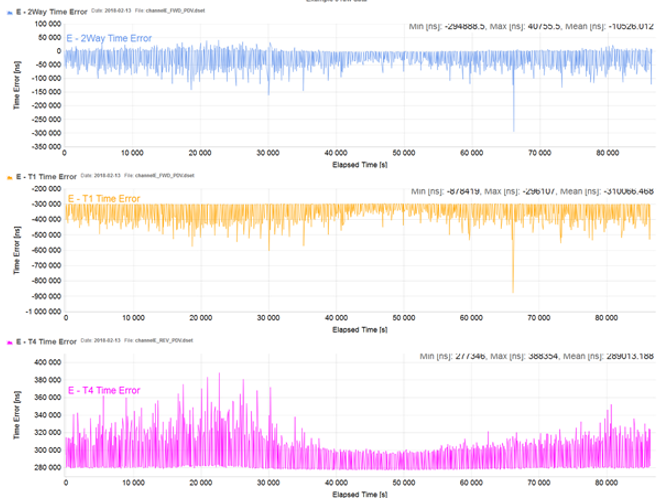
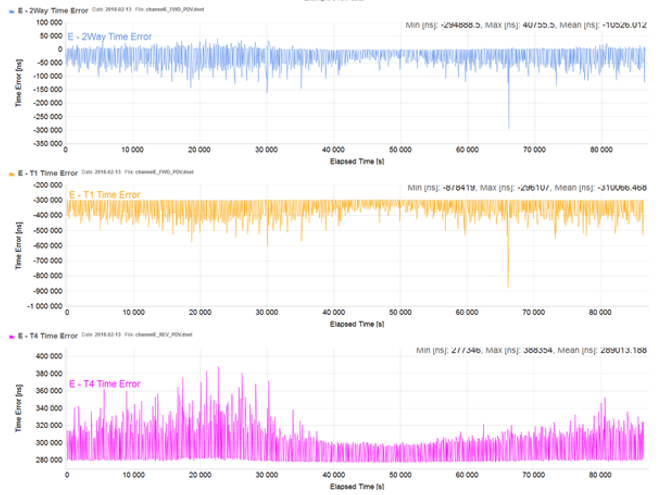
Example 1 (raw PDV data)
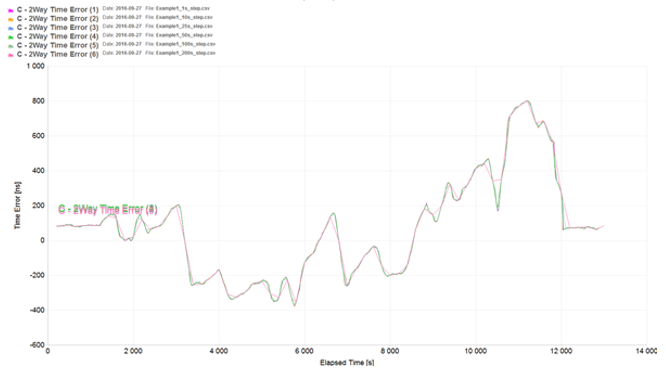
Example 1 (step size variation)
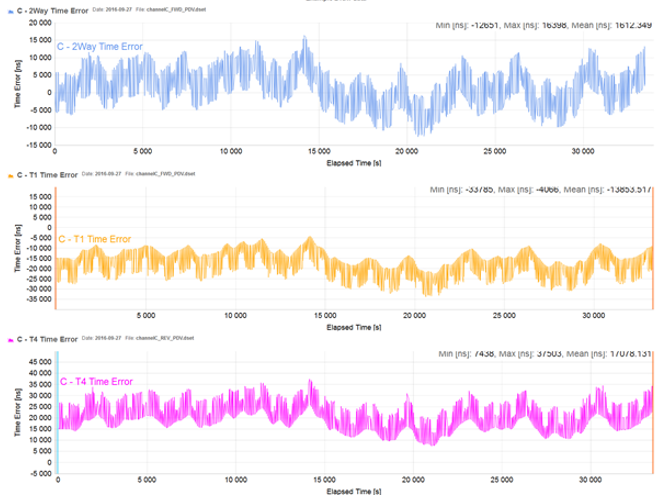
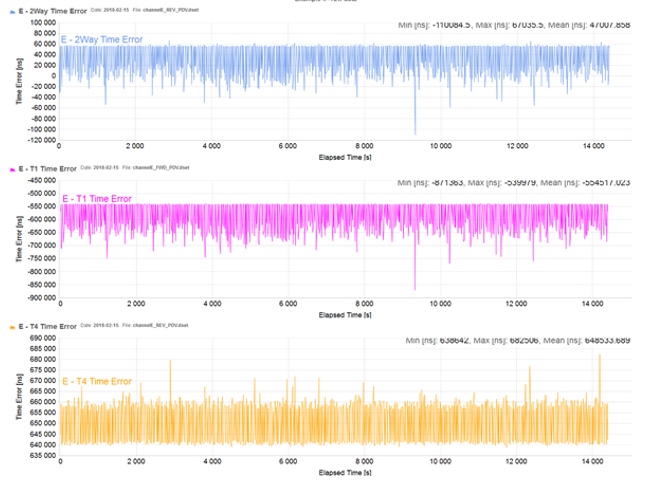
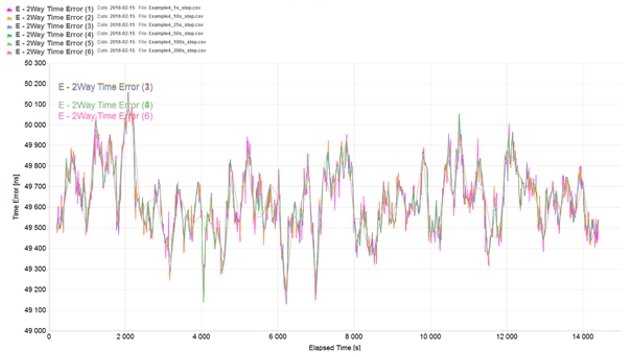
Example 2 (raw PDV data)
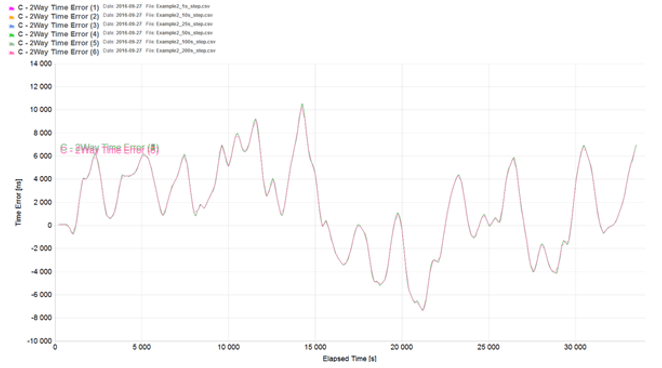
Example 2 (step size variation)
Example 3 (raw PDV data)
Example 3 (step size variation)
Example 4 (raw PDV data)
Example 4 (step size variation)
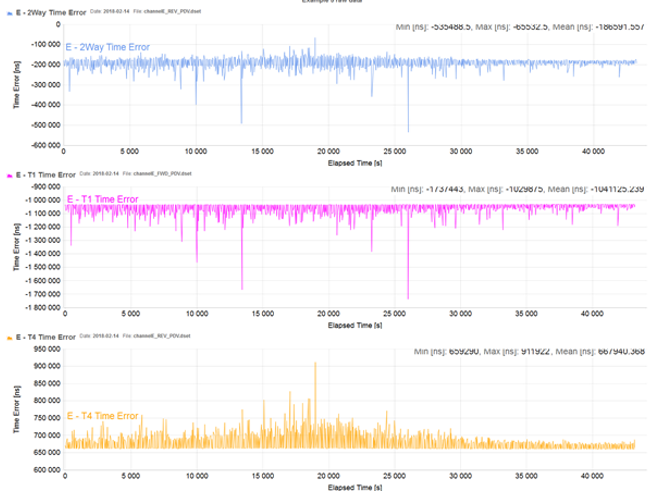
Example 5 (raw PDV data)
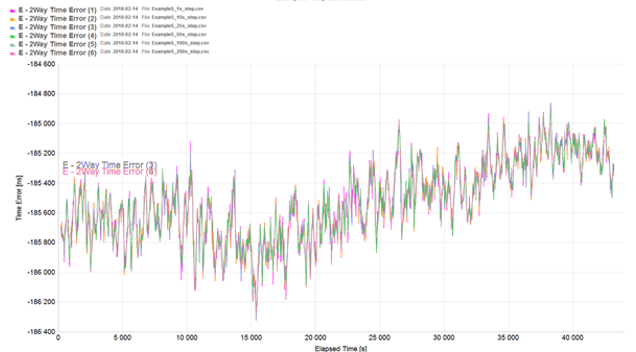
Example 5 (step size variation)
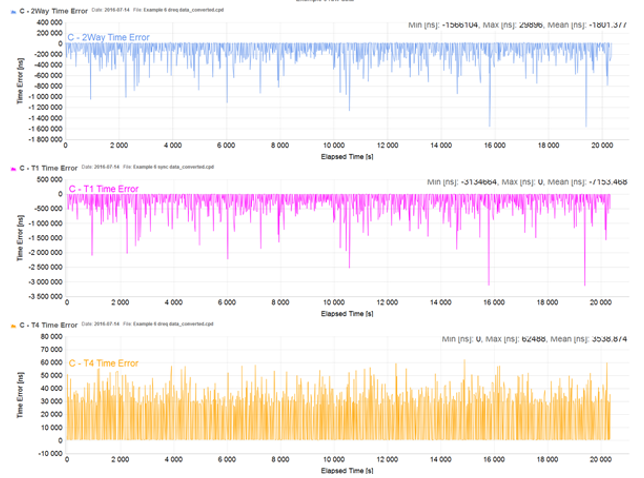
Example 6 (raw PDV data)
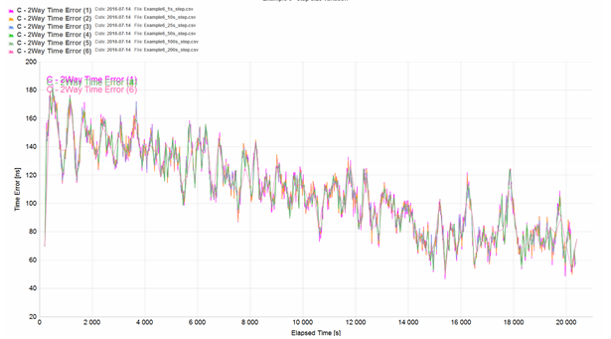
Example 6 (step size variation)
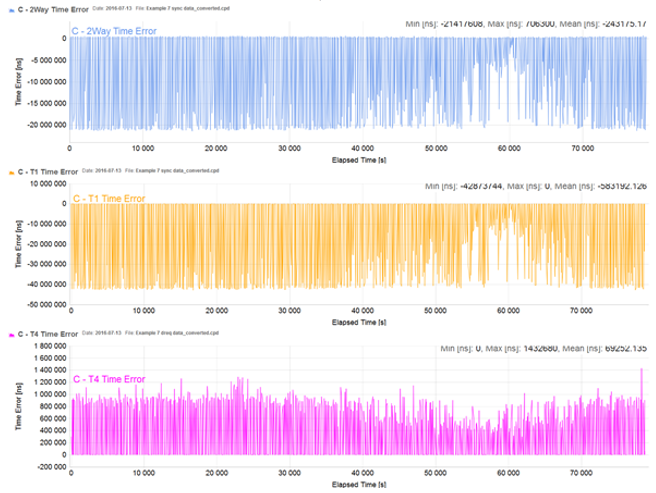
Example 7 (raw PDV data)
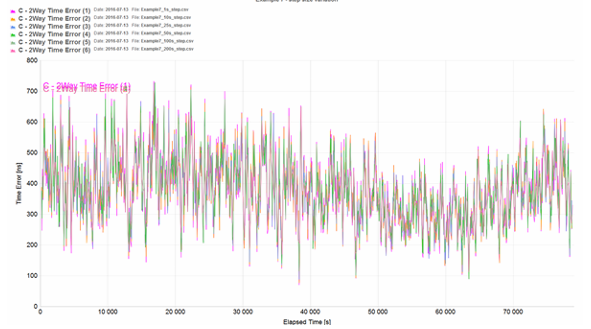
Example 7 (step size variation)
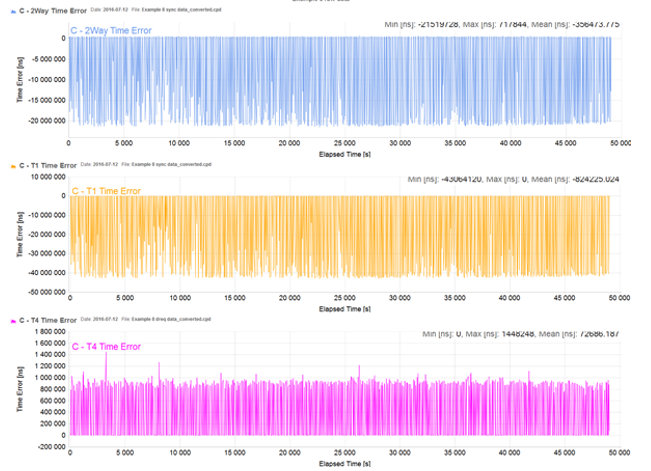
Example 8 (raw PDV data)
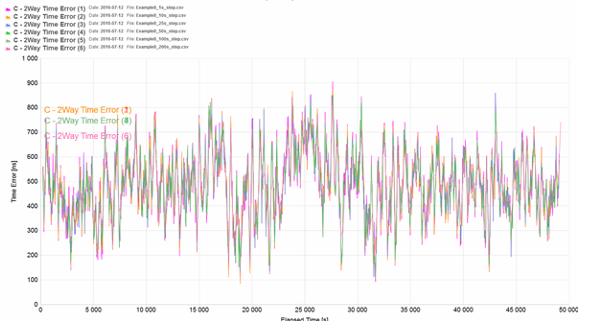
Example 8 (step size variation)
Appendix 2: Peak value data
The following table gives the peak values (maximum and minimum) for each example at the different step sizes. The “error” columns are the difference between the recorded value, and that recorded for a 1s step size.
Data set | Step size | Peak-to-peak | P-P Error | Maximum | Error in max peak | Minimum | Error in min peak |
|---|---|---|---|---|---|---|---|
Example 1 | 1s | 1181 | 0 | 802 | 0 | -379 | 0 |
10s | 1181 | 0 | 802 | 0 | -379 | 0 | |
25s | 1176 | 5 | 802 | 0 | -374 | -5 | |
50s | 1171 | 10 | 802 | 0 | -369 | -10 | |
100s | 1159 | 22 | 802 | 0 | -357 | -22 | |
200s | 1159 | 22 | 802 | 0 | -357 | -22 | |
Example 2 | 1s | 17900 | 0 | 10545 | 0 | -7354 | 0 |
10s | 17897 | 3 | 10543 | 2 | -7353 | -1 | |
25s | 17893 | 7 | 10543 | 2 | -7349 | -5 | |
50s | 17885 | 15 | 10543 | 2 | -7341 | -13 | |
100s | 17587 | 313 | 10245 | 300 | -7341 | -13 | |
200s | 17587 | 313 | 10245 | 300 | -7341 | -13 | |
Example 3 | 1s | 2190 | 0 | -8857 | 0 | -11047 | 0 |
10s | 2187 | 3 | -8857 | 0 | -11044 | -3 | |
25s | 2181 | 9 | -8857 | 0 | -11038 | -9 | |
50s | 2041 | 149 | -8952 | 95 | -10993 | -54 | |
100s | 2020 | 170 | -8972 | 115 | -10993 | -54 | |
200s | 1930 | 260 | -8990 | 133 | -10920 | -127 | |
Example 4 | 1s | 1464 | 0 | -184861 | 0 | -186325 | 0 |
10s | 1460 | 4 | -184865 | 4 | -186325 | 0 | |
25s | 1464 | 0 | -184861 | 0 | -186325 | 0 | |
50s | 1331 | 133 | -184932 | 71 | -186263 | -62 | |
100s | 1323 | 141 | -184940 | 79 | -186263 | -62 | |
200s | 1280 | 184 | -184983 | 122 | -186263 | -62 | |
Example 5 | 1s | 1464 | 0 | -184861 | 0 | -186325 | 0 |
10s | 1460 | 4 | -184865 | 4 | -186325 | 0 | |
25s | 1464 | 0 | -184861 | 0 | -186325 | 0 | |
50s | 1331 | 133 | -184932 | 71 | -186263 | -62 | |
100s | 1323 | 141 | -184940 | 79 | -186263 | -62 | |
200s | 1280 | 184 | -184983 | 122 | -186263 | -62 | |
Example 6 | 1s | 137 | 0 | 184 | 0 | 47 | 0 |
10s | 132 | 5 | 182 | 2 | 50 | -3 | |
25s | 132 | 5 | 182 | 2 | 50 | -3 | |
50s | 132 | 5 | 182 | 2 | 50 | -3 | |
100s | 132 | 5 | 182 | 2 | 50 | -3 | |
200s | 127 | 10 | 177 | 7 | 50 | -3 | |
Example 7 | 1s | 662 | 0 | 732 | 0 | 70 | 0 |
10s | 650 | 12 | 727 | 5 | 77 | -7 | |
25s | 640 | 22 | 727 | 5 | 87 | -17 | |
50s | 638 | 24 | 727 | 5 | 89 | -19 | |
100s | 603 | 59 | 704 | 28 | 101 | -31 | |
200s | 589 | 73 | 701 | 31 | 112 | -42 | |
Example 8 | 1s | 821 | 0 | 905 | 0 | 84 | 0 |
10s | 789 | 32 | 874 | 31 | 85 | -1 | |
25s | 757 | 64 | 859 | 46 | 102 | -18 | |
50s | 748 | 73 | 851 | 54 | 103 | -19 | |
100s | 739 | 82 | 842 | 63 | 103 | -19 | |
200s | 678 | 143 | 842 | 63 | 164 | -80 |
Related Articles
On this page: